Data Visualization
-
In this article, I’ll show you how to use two popular Python libraries to carry…
13 min read -
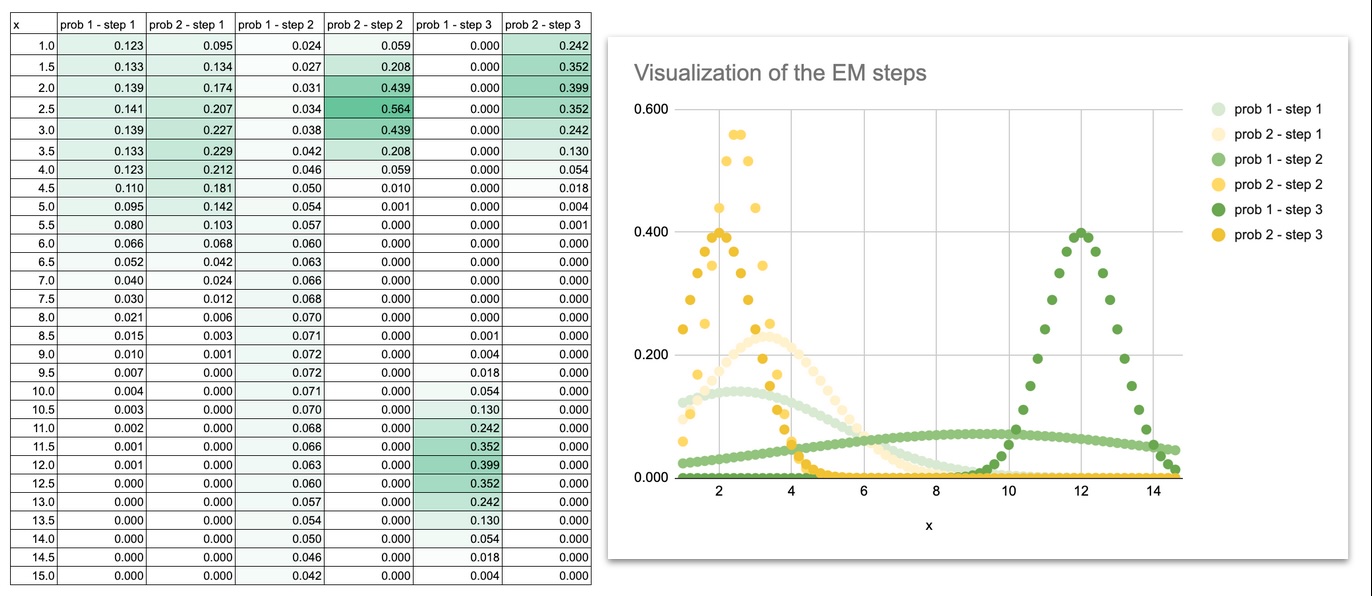
This article introduces the Gaussian Mixture Model as a natural extension of k-Means, by improving…
6 min read -
From local distance to global probability
10 min read -
The most dangerous KPIs aren’t broken; they’re the ones trusted long after they’ve lost their…
7 min read -

I Cleaned a Messy CSV File Using Pandas . Here’s the Exact Process I Follow Every Time.
Data ScienceStop guessing at data cleaning. Use this repeatable 5-step Python workflow to diagnose and fix…
17 min read -

Will conversational interaction replace SQL queries, KPI reports, and dashboards?
28 min read -

Data Visualization Explained (Part 5): Visualizing Time-Series Data in Python (Matplotlib, Plotly, and Altair)
Data VisualizationAn explanation of time-series visualization, including in-depth code examples in Matplotlib, Plotly, and Altair.
12 min read -

Why data-driven stories remain an evergreen tool for practitioners
3 min read -
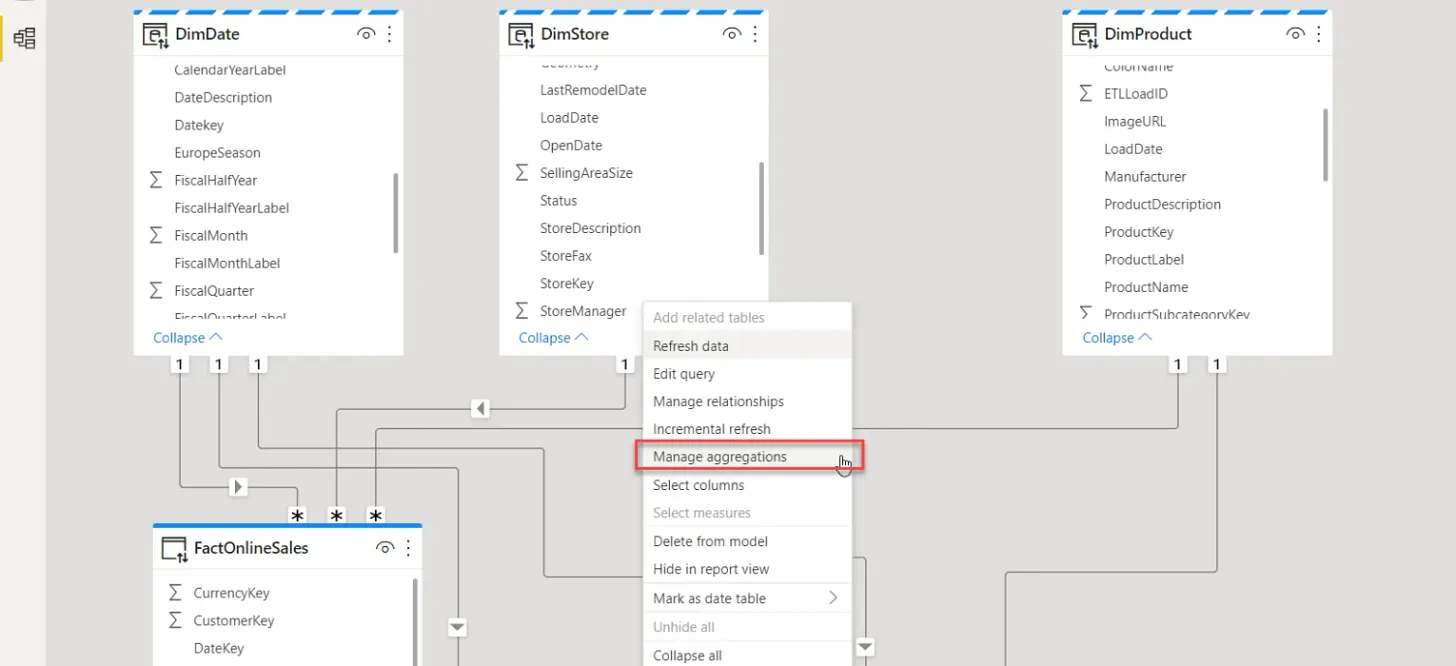
Aggregations are one of the most powerful features in Power BI — learn how to leverage…
10 min read -

Data is driving the future of business and here’s how you can be prepared for…
7 min read